Traffic data for your web site is a veritable gold mine. The problem is accessing that data quickly, easily, and in an interface that just makes sense. The majority of analytics services fail in all regards. You wouldn't be here if your current analytics service met your needs. The good news is that JDog Stats is different.
|
Easy to use
JDog Stats is designed to just make sense, but if you ever have a question, our knowledge base and customer support are just a click away. |
|

|
On-site analytics
You (and only you) will see the on-site analytics widget in the corner of your web site. See you how many total visitors are on your site and how many are on the page you're currently viewing, with the ability to view those visitors right from the widget. Heatmaps and heatmap segmentation can be launched from the widget as well. |
|
JDog Stats Heatmaps
In addition to standard per-page heatmaps, JDog Stats also lets you view heatmaps for individual visitor sessions, including segmentation. For example, you can view heatmaps only for visitors who completed a specific goal. Heatmap data is real time. |
|
|
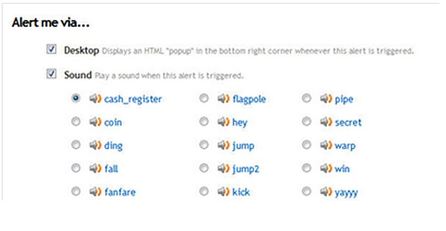
Alerts
Set Up alerts to be notified of conversions, campaign visitors, logged in visitors, and more. |
|
Everything is real time
All data in JDog Stats is up-to-the-minute real time. Not just a few reports. Everything. |
|
The 'Real Time' Advantage
JDog Stats is a real time web analytics service. This means that when you login and view your stats, you are seeing up to the minute data on the traffic to your web site. Most services don't let you see what's happening "today" until the day after.
Real time data lets you react to changes in your traffic as they occur. For example, if you had an article that hit the front page of a popular site like digg.com, you would see the traffic spike in JDog Stats immediately, along with links back to the sources sending you the traffic. Knowing this, you could make changes to your site or to the article itself to take advantage of the situation.
If instead you relied solely on a service like Google Analytics, it would be up to 24 hours before you even knew about the traffic, and by then it would be too late to do anything about it.
Today vs. the Past
JDog Stats is focused on real time, so by default we only show you the data from "today" when you login to view your stats. Historical data is of course available, however. Just click the blue drop down menu in the top right corner to get the menu shown to the right hand side.
Common choices such as yesterday and the last 30 days are available as default options. You can also view a custom date or date range by clicking the last item in the menu, "Custom date range...". With this option, you can view a date range for any report with up to 1 year of data. The exception is the Visitor log and the Action log pages - these are limited to 31 days maximum.
Common choices such as yesterday and the last 30 days are available as default options. You can also view a custom date or date range by clicking the last item in the menu, "Custom date range...". With this option, you can view a date range for any report with up to 1 year of data. The exception is the Visitor log and the Action log pages - these are limited to 31 days maximum.
|
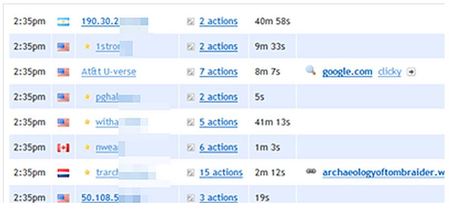
Individual visitors and actions
JDog Stats lets you see every visitor and every action they take on your web site, with the option to attach custom data to visitors, such as usernames or email addresses. Analyze each visitor individually and see their full history. |
Viewing the history for an individual page, search term, referring domain, etc
As mentioned in the previous section, you can view almost any report with up to a full year's worth of data. However, doing so just gives you the total sum for any individual item over that entire date range. What if you want to view up to a year's worth of history for any individual item? This is possible with just a single click, and is one of the most useful features of JDog Stats!
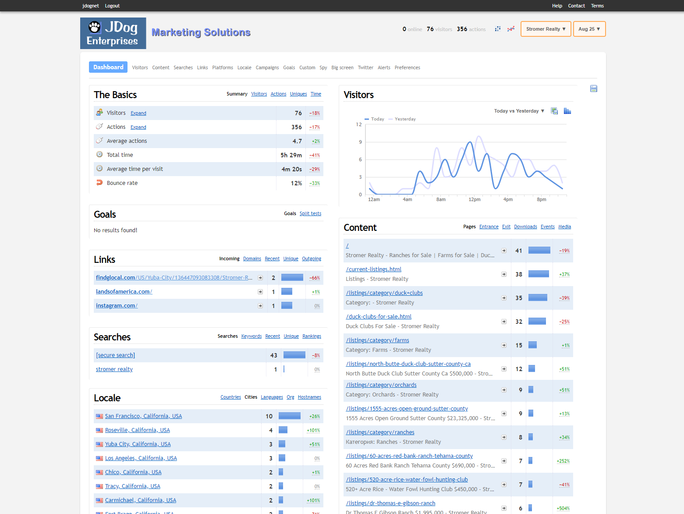
Below is an example of part of your site's dashboard that shows you the types of traffic sources to your web site. Each item has a number next to it representing how many visitors arrived from that type of traffic source. To the right of that number is what's called the "trend" for that item, vs the day before, taking into account the current time of day. (Green percentages are "good", and red are "bad". Green usually means "more", but sometimes more is bad).
To view the history for any item, simply click on the trend percentage, as shown below. By default you will see the last 30 days of data for that item, but there is a date drop down menu right above the graph which lets you view the daily values for up to 180 days, or the weekly sums for 26 weeks (half a year), or the monthly sums for the last 12 months. Some data types also support hourly data.
Visitor Segmentation
Segmentation is a fancy word for filtering. It means that instead of seeing data for all of your visitors combined, you can view just a specific "segment" of them.
Segmentation gives you priceless insight into your visitor's behavior, but the problem is that this feature is very difficult to use in most services. This is unfortunate, as this data is extremely valuable to any web site owner. Therefore, we set out to make segmentation as easy as possible.
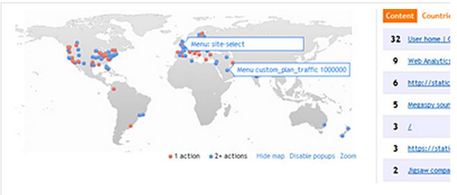
Essentially every report you look at, each item's name will be a link. For example, here is the top countries report:
Segmentation gives you priceless insight into your visitor's behavior, but the problem is that this feature is very difficult to use in most services. This is unfortunate, as this data is extremely valuable to any web site owner. Therefore, we set out to make segmentation as easy as possible.
Essentially every report you look at, each item's name will be a link. For example, here is the top countries report:

As you can see, each item in the report is a link. Clicking any of those items automatically invokes segmentation for that item. For example, if we click "Germany", we'll be taken to a new page that shows a summary of all visitors from Germany at the top, along with a list of every visitor below that (for individual study, if you desire):
From this page, there are many paths you can take, all of which will give you valuable data:
- View additional data about this segment of visitors:
Along with the summary data at the top of this window, you can also view more data about this group of visitors. For example, if you wanted to see the top web browsers or the top searches from visitors in Germany, click this menu and choose the option you want. Any data you want about this segment is 1 click away.
- Compare these visitors to another segment of visitors
So you're looking at Germany, now how does that compare to Austria? JDog Stats makes that question a snap to answer. On the right hand side of the summary table above, there are 3 columns. The first is data about the current segment. The second is data about all of your visitors. The last column compares the first two. At the top of the second column is an icon . Clicking this will open a menu to create a segment for a second group of visitors. Choose Countries, then Austria, and you're done - you'll immediately see a comparison between visitors from these two countries! - Add another filter
You can add as many filters as you want. You could view visitors from Germany who use Internet Explorer 7on Windows 7 and speak Chinese. All you have to do is click the blue "Add another filter" menu and go hog wild. - View a different segment
If you want to view a country other than Germany, no need to go back to the last screen. Simply click the word "Germany", and a menu will pop down with a list of the top 10 countries for the date range you are viewing. If the one you want isn't in that list, you can type it in a box at the bottom of the menu.
Twitter Analytics
A lot of people are talking about you and/or your web site. But do you know what they're saying? It's hard to keep track of it all. That's why we created the best Twitter Analytics service on the planet, and built it right into JDog Stats. You simply enter in keywords that you want to monitor on Twitter, we'll automatically do the rest for you, creating beautiful reports like the one below.
You can filter the individual tweets by all sort of criteria (e.g. ones containing links, one with questions, ones with a positive tone), and you can reply or retweet directly from JDog Stats.
You can filter the individual tweets by all sort of criteria (e.g. ones containing links, one with questions, ones with a positive tone), and you can reply or retweet directly from JDog Stats.
|
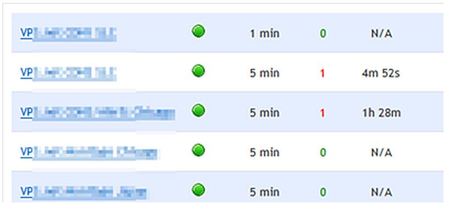
Uptime monitoring
JDog Stats alerts you when your site goes offline so you can react immediately. Your site's uptime is monitored from 5 geographic locations around the world and alerts are only sent when a majority of the monitoring servers agree that your site is down. |
And so much more...Powerful and flexible API. Twitter analytics. Google search rankings.Video analytics. Big screen mode. Sub-users. The best bounce rate in the biz. HTTPS tracking.
The list of features is nearly endless.
Compare JDog Stats against the competition!
The list of features is nearly endless.
Compare JDog Stats against the competition!